Openmaru Cloud APM optimized for Openshift & Kubernetes
OPENMARU APM is the first product in Korea that can monitor Docker containers that cannot be monitored with existing APM and WAS running on Docker containers.
Monitoring issues in PaaS-type cloud
OPENMARU APM optimized for PaaS-type cloud
Provide information necessary for operation in virtual OS environment
Real-time provision of CPU/Memory/Disk/Network information in virtual OS environment
Auto scaling visual tool provided
Load distribution during auto scaling and identification of processing status by pod
POD provides status information
Provide search and status information for retired POD instances
Provide WAS essential monitoring tools
Provide essential analysis tools in WAS failure situations
Container monitoring function
In a container environment, overall monitoring of distributed pod locations, container resources, etc. is required. With Openmaru Cloud APM, operators can conveniently monitor containers (pods).
- Provides the number of container images and container status
- Provide the container’s CPU utilization
- Providing container and image information
- Provides the container’s memory utilization

Performance monitoring function of WAS operated in container
When monitoring WAS resources and WAS applications in a container environment, you must use a specific tool or access the Docker container to check logs. Openmaru Cloud APM monitors WAS resources and applications connected by specific groups. Provides WAS resource and WAS application monitoring function in container.
- Container WAS resource (HEAP memory) monitoring (check container HEAP memory usage)
- Real-time monitoring of container WAS applications (check real-time TPS, active user, and response time for each container)
- Container WAS error rate monitoring (check the error rate (4xx, 5xx) in container WAS)
- Container WAS APDEX monitoring (monitoring the APDEX Score of container WAS)

Monitoring function for stateless WAS instance in PaaS environment
Openmaru Cloud APM provides a way to obtain information to identify the cause of failure after a non-existent container stops in the PaaS environment. Since information about containers that do not exist is stored, it is possible to identify the cause of failure and take corrective action.
- Support for monitoring non-existent containers
- Real-time data collection (record non-state information)
- Stateless instances can be retrieved
- Possible to search data at the point of failure that disappeared
- Can identify the cause of instance failure

Volatile containers can be tracked and monitored
When stopped in a container environment, it is impossible to analyze logs and track the cause of container failure, but Openmaru Cloud APM keeps all records of volatile instances, so it is possible to accurately identify the cause in case of failure by tracking container data in the past.

OPENMARU Cloud APM specialized in troubleshooting
Openmaru Cloud APM is a monitoring solution that can operate the service in an optimal state through application performance monitoring and diagnosis, and failure cause analysis.
- Thread dump analyzer (Lock traceable, URL information displayed)
- JVM memory object analyzer (analysis/comparison of objects occupying Java memory)
- Network Status Analyzer (Analyzes Java processes, networks the system is using)
- Open file analyzer (Analyzes files opened by Java process)
- System Process Analyzer (Analyze, compare process CPU, memory usage on your system)
- Data trend analysis (a function that analyzes the trend of increase or decrease in past data)

Application error monitoring function
Openmaru Cloud APM can track exceptions in applications.
You can check which type of exception occurred by tracing multiple exceptions. Openmaru Cloud APM can also track WARN and Error Level values output from the logging library.
- Warning messages can be checked according to the logging level
- When SQL message occurs, trace and check exception and error message
- Error Message can be checked when an Out of Memory Error occurs
- Runtime exception can be confirmed as Error Message

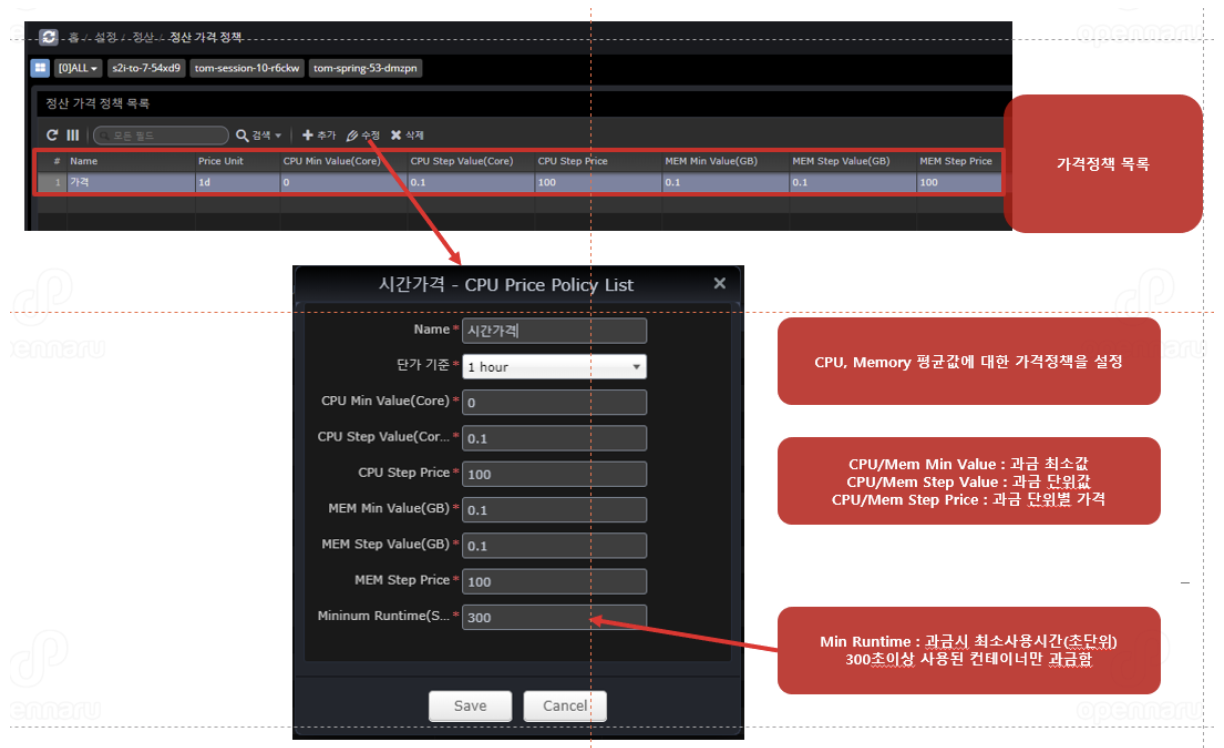
Even container metering with Openmaru Cloud APM!
Every time a container is deployed, the existing container is discarded and a new container is created, and it is very difficult to track because it is auto-scaling according to the load.
In some cases, a container floats for only 10 or 20 minutes a day and then disappears, so applying a simple daily billing policy may result in an unreasonable amount.
However, OpenMaru APM calculates the billing based on the average value of CPU and memory usage per hour, so accurate billing can be done.