About OPENMARU APM
Application Performance Management (APM) is a solution that monitors the performance and status of business applications used by companies. APM is software for reacting quickly and preventing problems when business applications perform poorly or stop. APM, which monitors a single system implemented in WAS-based JAVA, is an essential solution for operation in monitoring performance such as end-user response time and interaction between transactions in environments where this type of middleware is complex and diverse. Customers have a problem when certain pages are slow or they cannot log in. When a database, network, or storage fails, it is a system-wide problem, so it must be recognized quickly and the response method must be clear. Service can be provided stably by introducing APM that can quickly identify failure points of applications or systems, analyze causes, and support tuning.
This is the WAS dashboard screen of OPENMARU Cloud APM. With an intuitive interface that enables real-time monitoring, you can see the operation status of the service at a glance, so you can quickly find problems and take corrective action in the event of a failure.
How many users have entered, how well user requests are being processed, how they are distributed, how long the processing time is, whether there are any errors, and whether there are any problems with memory, DB, or performance. These information can be viewed at a glance on the dashboard screen. can figure it out. It also provides monitoring of system resources so that you can identify problems in the system itself as well as in WAS.
Need for OPENMARU APM
Looking at the reasons APM is needed in the actual operating environment, it is necessary to solve the performance of developed applications, debugging, and recurring issues, optimization of service performance in operation, rapid failure detection and quick action, suitability of operating environment, and services used by customers. APM is a solution that can accurately see if there are any problems.
Ability to proactively predict anomalies before reaching critical values
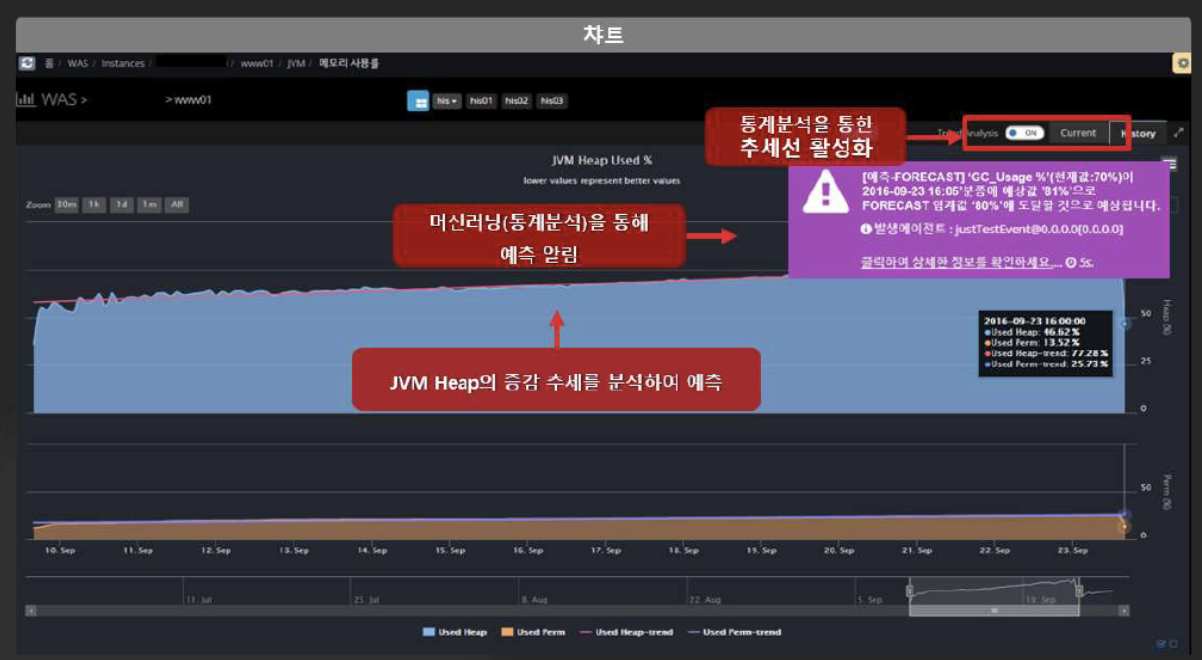
Real-time machine learning (statistical analysis) notifies you of an event that a threshold set by the administrator will be reached in the next few minutes. APM notifies you of events in advance by predicting when thresholds will be reached through current condition monitoring and trend analysis.
quick service
Real-time inquiries are possible with the quick service function. It is no longer necessary to collect logs or request an engineer visit to analyze the cause of failure.
If you click Quick Service on the screen, the currently displayed screen shot, thread dump, and meta information are received to automatically create a case, and at the same time, a system diagnosis report is delivered.
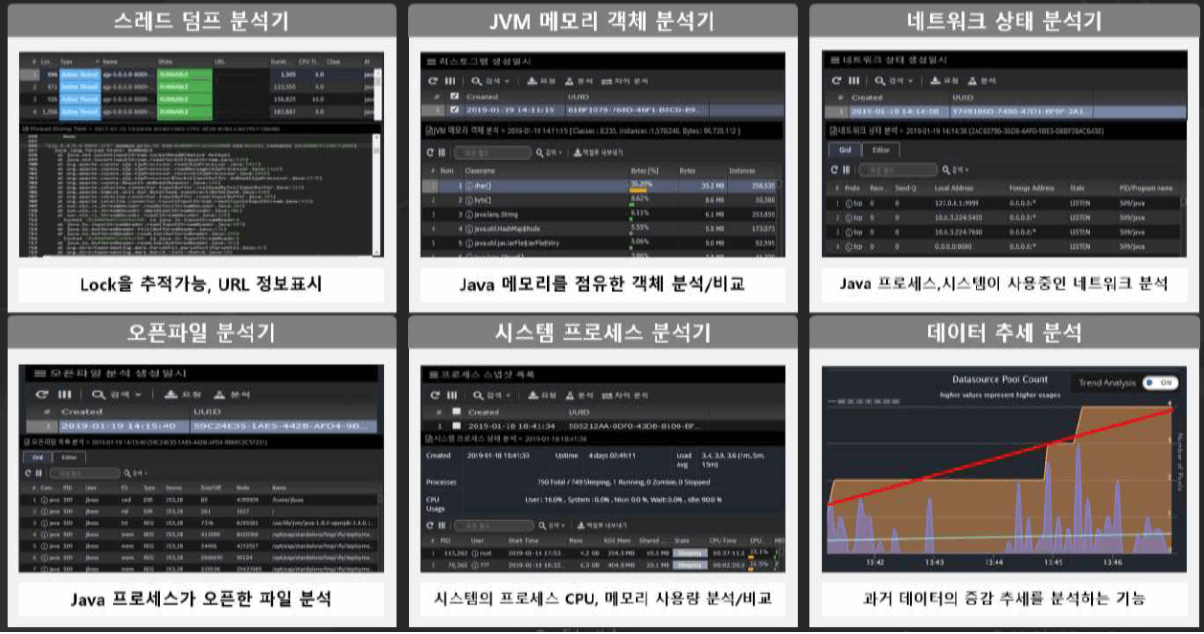
Specialized in trouble shooting
APM provides thread dump, JVM memory, network status, and system process analyzer at a glance so that the service can be operated in an optimal state through application performance monitoring and diagnosis, and failure cause analysis.